
Topics
March 07, 2018
Feedback as Proof of ROI: Best Practices for Using Qualitative Data to Complement L&D ROI

A visual dashboard showcasing a suite of ROI metrics on the effect of learning programs on business initiatives is the holy grail for learning measurement.
Learning professionals seek hard, quantifiable data before a chat with the CFO because executives expect ROI. Training managers are moving from the Level 1 “Smile Sheets” to focus on business KPIs. However, simple, qualitative evaluations can provide important customer feedback and useful insights to tweak content, enhance trainer effectiveness, and prove ROI. With the focus on “big learning data” and adaptive learning, perhaps the pendulum has swung too far away from qualitative feedback. The truth is, as always, somewhere in the middle. The data may secure the funding, but it’s the narrative that drives change. Learning teams should take a complementary approach using qualitative data in addition to quantitative data as “proof” of ROI.
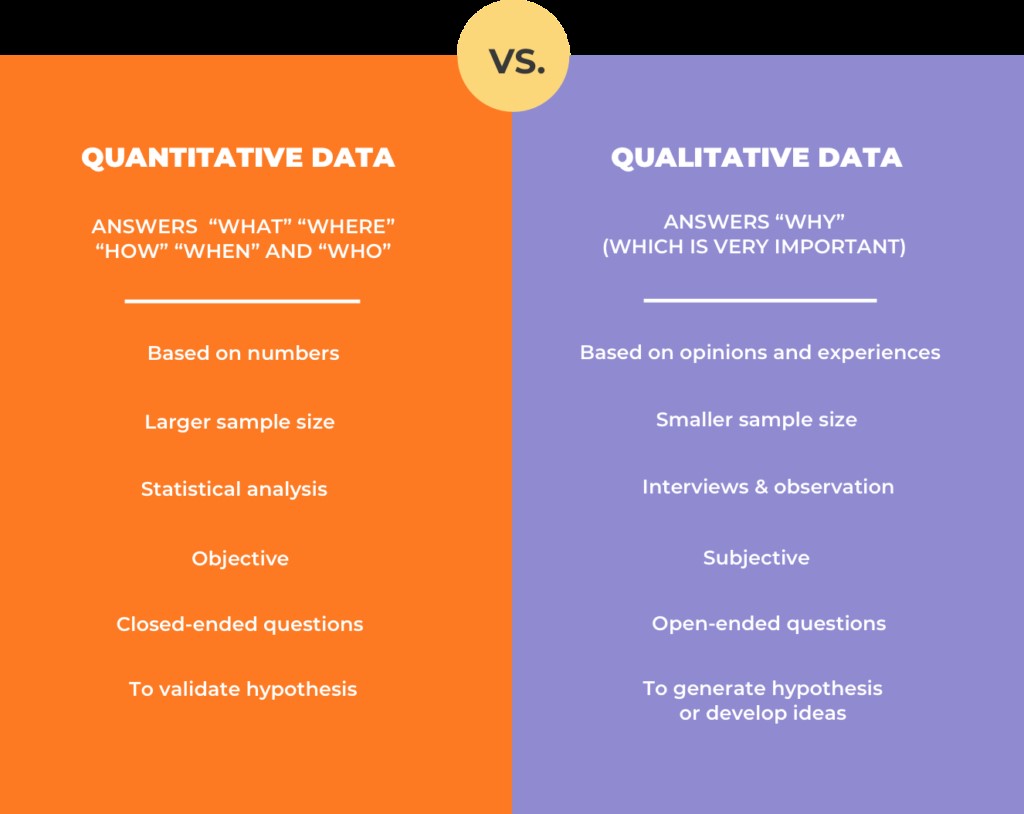
QUAN/QUAL - WHAT’S THE DIFFERENCE?
Quantitative data analysis focuses on objective numbers and mathematical calculations to determine impact. Cost, increased sales, a decrease in attrition are examples of quantitative data. These are the numbers and charts used in traditional ROI calculations to demonstrate the numerical value of a training program.
Qualitative data analysis focuses on subjective descriptions of observable information. Qualitative methods can be used to add richness to existing data, verify quantitative measures, identify unintended outcomes, and enhance quantitative measures. Interviews, focus groups, open-ended survey questions, observations, and document analysis are examples of useful qualitative data to prove ROI.
Qualitative analysis is often used when there are unknowns in a new training program during an agile pilot when testing intervention success. Qualitative information provides helpful insights on where and how to adjust to maximize effectiveness. When proving ROI, it’s helpful to have a “concrete narrative showing the value of training and proving its effectiveness with examples.” These concrete narratives – much like the Glove on the Boardroom Table – can have a significant impact on senior executives. The best use for qualitative data is a complement to existing quantitative measures to see how outcomes were achieved and to identify insights for program improvement.
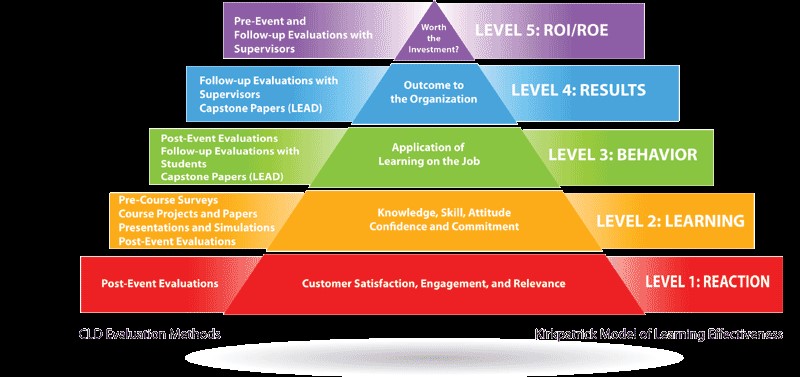
INTEGRATING QUALITATIVE DATA INTO KIRKPATRICK LEVEL ANALYSIS
Level 2: Knowledge – It can be difficult to draw a direct link between the knowledge increased to ROI, but using targeted pre- and post- qualitative data can tell a strong story. LivesySolar, a healthcare marketing firm, uses “mystery calls” before and after training to assess learning objective achievement. They gather both quantitative (call time, leads generated, etc.) and qualitative (could the employee provide good opening examples, handle tricky questions, etc.) data to calculate the training impact.
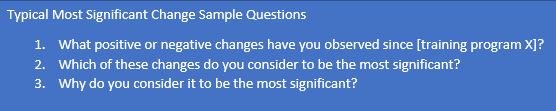
Level 3: Behavior – Behavior change is difficult to measure using traditional quantitative metrics. Qualitative approaches can assess meaningful change and build the stories that support ROI numbers. In higher education, the most significant change (MSC) approach is used to complement existing evaluation methodologies through non-threatening input that captures powerful impacts from training programs. These stories of change provide context to the overall business impact.
Level 4: Results – The Center for Creative Leadership (CCL) collects both quantitative and qualitative data to assess Leadership Development Program effectiveness. They capture 360 feedback - including rich verbatims– before training and 3-6 months following training. The narrative information is used by an employee’s manager and performance coaches to measure change on specific dimensions. Through rich feedback, CCL is able to demonstrate quantitative impacts from qualitative data. For examples, CCL can report on the ability to handle complex challenges, ability to use feedback to make changes to their leadership approach, and reported improvements or significant improvements in organizational effectiveness.
WHAT CAN YOU DO NOW?
When considering more subjective measurement to complement ROI calculations, consider a few key steps to ensure success
- Know Your Audience – The CFO might care more about the stats than the head of sales or customer experience. Tailor your messages to the intended recipients based on their data preferences.
- Collect to Test & Learn – use interviews or focus groups for your pilot training. Collect richer initial feedback to hone your quantitative instruments and uncover unintended benefits or risks. Employee feedback can help market new initiatives – add a “here’s what people are saying” section to your marketing can help adoption.
- Boost Your Qualitative Skills – Hone your interview, observation, and focus group skills or use trained industrial/organizational psychologists. Qualitative researchers who know about inter-rater reliability and member checks can make your feedback even more robust.
Adding qualitative data as a complement to quantitative numbers can enhance the ROI story and highlight the impact of your training for senior leaders.
Topics